The Weather Book of Poor Will’s Almanack contains daily, weekly and monthly weather summaries applicable to most regions east of the Mississippi River along and near the 40th Parallel. The summaries provide data about what kind of weather has occurred in the past and what kind of weather is likely in the future. In addition, The Weather Book contains directions about how to use its information to make general forecasts.
Description
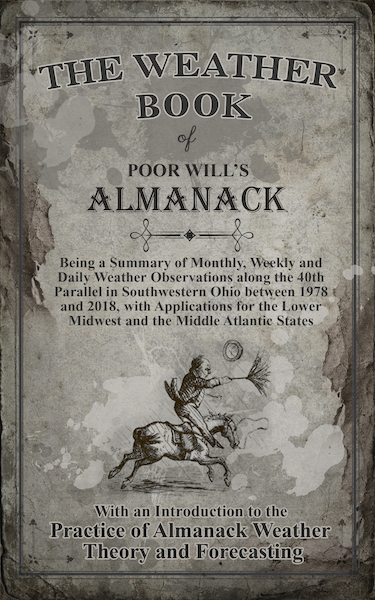
THE WEATHER BOOK
BOOK
OF
POOR WILL’S ALMANACK
Being a summary of monthly, weekly and daily weather observations along the 40th Parallel in southwestern Ohio between 1978 and 2018
With an Introduction to the
Theory and Practice of Almanack Weather Forecasting
The weather information in this Weather Book is based on my charts of fractal weather patterns I made between 1978 and 2019. Readers of my weekly and monthly columns throughout the United States have used these estimates since 1984.
How to Use The Weather Book
First, check the monthly overview at the beginning of each month’s section to see if and when a cold front may be approaching. Often milder weather occurs in advance of a cold front, and cooler weather usually follows.
For example, notice that a cold front usually occurs on or about January 1. This front is typically preceded by precipitation on New Year’s Eve, and cold weather follows.
Second, check the characteristics of the approaching cold front in the front description for Wintercount, Springcount, Summercount or Autumncount that briefly describe these weather systems. These descriptions follow the monthly overviews.
For example, the front of January 1 is described as follows: “The New Year’s front is usually one of the most severe systems so far in the winter, and it is preceded by sleet or snow as far south as northern Florida. After its passage, temperatures are typically quite cold. A secondary disturbance often causes additional precipitation on the 2nd and 3rd.”
Third, check The Weather Book’s weekly weather summary for the week of the time in question, and then read the daily weather summaries around that period. These summaries do not offer predictions, but they do present an overview of the kind of weather that has occurred in the past around the arrival of the weather system in question.
For example, the Week 1 summary states the following about the period: “The warmest days of January’s first quarter are typically the 3rd and the 6th, each having a 25 percent chance of highs above freezing. Cold comes too, however. The first major cold front of the year arrives the last day of December or the 1st or 2nd of January, and most days between the 1st and the 7th have a 30 to 40 percent chance of highs only in the 20s or teens. Clouds usually dominate the sky this week: there is just a 40 percent chance of Sun between the 1st and 3rd, and there is even a 70 percent chance of completely overcast conditions on the 6th. Precipitation is lightest on the 1st (a 30 percent chance), but heaviest on the 2nd and 3rd (around a 50 percent chance). Chances of precipitation on the other days this week are in the 40 percent range.”
In addition, the daily descriptions of January 1 and 2 provide still more detail:
January 1
“Today is mild 25 percent of the time, reaching into the 40s or 50s; otherwise January 1st is a chilly day in the 20s (twenty-five percent of the time) or 30s (fifty percent of the time). A morning below zero is rare – although 95 percent of the dawns dip below freezing. When precipitation does occur (and that is just 25 percent of the time), it typically accompanies the windy first cold front of Deep Winter.”
January 2
“January 2 brings high temperatures in the 40s just ten percent of the time. Seventy percent of the afternoons are in the 30s, fifteen percent in the 20s; five percent of the highs don’t even reach zero. Rain or snow comes half the time on this date.”
Fourth, check the phase of the moon. You don’t have to be an astronomer to do this. Your weather app or a newspaper can provide this information. What you are looking for is pretty straight forward: Full moon and new moon bring stronger frontal weather activity a significant percentage of the time.
Note that if the moon is at perigee (its position closest to Earth), lunar influence will be greater still. When a “Supermoon” occurs, the full moon is at its point nearest the Earth, and weather conditions are most likely to be stormy. This information may or may not be always be available from your sources, but you should always be able to find information about full or new moon.
For example, if January 1 falls on or about the time of full or new moon, you might definitely expect a stronger storm on New Year’s Eve and a very cold first week of January. If the moon happens to be especially close to Earth (a Supermoon), expect even more extreme weather.
Are Almanack Weather Estimates Practical?
While this weather book is the result of a local record, readers of Poor Will’s Almanack from Wyoming to Vermont have found it useful since 1984. Keep track of your own weather and let me know how Almanack Weather principles work for you. Remember that The Weather Book descriptions and data portray trends and cycles as well as what has happened in the past in a specific location.
Your weather, of course, will be somewhat different, but with practice, you will hopefully be able to track the correspondence between what happens in your yard and what has happened in southwest Ohio along the 40th Parallel. And as the climate changes, you should be able to become more aware of how weather on any particular day varies from previous conditions.
Write me at P.O. Box 431, Yellow Springs, Ohio 45387 or at [email protected].
Even more details and almost forty years of nature notes are available in my Daybook for the Year available in 12 volumes from Amazon.
Only logged in customers who have purchased this product may leave a review.


Reviews
There are no reviews yet.